Exporting test runs to InfluxDB and Grafana

After doing a similar exercise with Splunk, I decided to give a try to Grafana along with InfluxDB. The idea was to use Grafana to analyze and visualize test results, in this case from a well-known test management solution, Xray, where I work btw.
I've met Grafana in the past but never implemented an end-to-end scenario with it. Well, it was time; hope this helps you out and inspires you to try some of these tools. In this rather long detailed article, we'll also cover InfluxDB and how it can be useful to store time series data.
Background
Xray
Xray is a well-known test management solution that works highly integrated with Jira (it needs it, actually). Xray cloud (i.e., for Jira cloud) provides a REST API and a GraphQL API. The latter is more powerfull and that's the one we can use to extract the test runs.
The Xray server/datacenter product provides a REST API only, for the time being. In this case, there's an endpoint that we can use to export the test runs from.
InfluxDB
InfluxDB is a time series database. It can be used to store and query our time-related data: in this case our test runs. It also provides integration with Grafana among other.
Grafana
Grafana is a platform used to analyze and visualize data, supporting multiple sources, dashboard customization, plugins, and more.
How to
I started by trying to use Grafana directly to import the test runs from the source application (i.e., Xray), using either the GraphQL API, for Xray cloud, or the REST API, for Xray server/DC.
It's possible to do so using some Grafana plugins (GraphQL, JSON API, Infinity) but we will face many limitations, including:
- unable to deal with pagination of the underlying APIs;
- overload of API request, as data needs to be fetched each time it is needed
- limited query capabilities
These are just a few; I won't cover the configuration of these or explore this further to not make this article too exhaustive.
So, as this initial approach was unsuccessful, I tried to depict what would be the proper architecture for this. As a consequence, I came with something like this: Xray > InfluxDB > Grafana.
Extracting test runs from Xray
The first step is to extract data from Xray. Here, we actually have two different product flavors: one for server/datacenter and another cloud based. The underlying APIs are different, so I had to make two different implementations; in your case, you'll probably just need one of them.
Extracting test runs from Xray cloud
To achieve this, I've implemented some code in JavaScript.
The code ahead uses a JQL expression to define the source of the data; in this case, I aim to export all test runs from project "CALC" in Jira, based on the related Test Execution issues. We need to obtain the related issue ids (Jira internal ids) of these, as the getTestRuns GraphQL function requires us to pass them (or the Test issue ids, if we prefer to obtain test runs based on that).
The code also has some basic logic to deal with pagination on the GraphQL requests; more error handling should be provided btw as, for example, the API can return temporary errors or rate limiting errors.
There's also logic to export test runs based on a modification date, and use that to avoid exporting them on next export operations.
var axios = require('axios');
const { GraphQLClient, gql } = require('graphql-request')
const fs = require('fs');

var xray_cloud_base_url = "https://xray.cloud.getxray.app/api/v2";
var xray_cloud_graphql_url = xray_cloud_base_url + "/graphql";
var client_id = process.env.CLIENT_ID || "215FFD69FE4644728C72182E00000000";
var client_secret = process.env.CLIENT_SECRET || "1c00f8f22f56a8684d7c18cd6147ce2787d95e4da9f3bfb0af8f02ec00000000";

var authenticate_url = xray_cloud_base_url + "/authenticate";

// Jira JQL query to define the list of Test Execution issues to export test runs from
jql = "project=CALC and issuetype = 'Test Execution'"


async function getTestExecutionIds (jql, start, limit) {
  return axios.post(authenticate_url, { "client_id": client_id, "client_secret": client_secret }, {}).then( (response) => {

    var auth_token = response.data;
    const graphQLClient = new GraphQLClient(xray_cloud_graphql_url, {
        headers: {
          authorization: `Bearer ${auth_token}`,
        },
      })

      // console.log(auth_token);

      const testexec_ids_query = gql`
      query
      {
          getTestExecutions(jql: "${jql}", limit: ${limit}, start: ${start}) {
            results{
              issueId
            }
          }
      }
`

    return graphQLClient.request(testexec_ids_query).then(function(data) {
      testexec_ids = data['getTestExecutions']['results'].map(function(t){
        return t['issueId'];
      });

      // console.log(testexec_ids);
      return testexec_ids;
    }).catch(function(error) {
      console.log('Error performing query to obtain Test Execution ids: ' + error);
    });
  }).catch( (error) => {
      console.log('Error on Authentication: ' + error);
  });
}


async function getTestRuns (testExecIssueIds, start, limit, modifiedSince) {
  return axios.post(authenticate_url, { "client_id": client_id, "client_secret": client_secret }, {}).then( (response) => {

      var auth_token = response.data;
      const graphQLClient = new GraphQLClient(xray_cloud_graphql_url, {
          headers: {
            authorization: `Bearer ${auth_token}`,
          },
        })

        testexec_ids = testExecIssueIds.map(function(t){
          return '"' + t + '"';
        }).join(',');

        // console.log(testexec_ids);

        const query = gql`
        {
          getTestRuns(testExecIssueIds: [${testexec_ids}], limit: ${limit}, start: ${start}, modifiedSince: "${modifiedSince}"  ) {
            total
            start

            results{
              id
              status{
                name
                description
              }
              comment
              evidence{
                filename
                downloadLink
              }
              defects
              executedById
              startedOn
              finishedOn
              assigneeId

              testType{
                name
              }

              steps {
                  id
                  action
                  data
                  result
                  customFields {
                    name
                    value
                  }
                  comment
                  evidence{
                    filename
                    downloadLink
                  }
                  attachments {
                      id
                      filename
                  }
                  defects
                  actualResult
                  status {
                    name
                  }
              }

              scenarioType
              gherkin
              examples {
                  id
                  status {
                      name
                      description
                  }
                  duration
              }

              unstructured

              customFields {
                  id
                  name
                  values
              }

              preconditions(limit:10) {
                results{
                    preconditionRef {
                        issueId
                        jira(fields: ["key"])
                    }
                    definition
                }
              }
              test {
                  issueId
                  jira(fields: ["key"])
              }
              testExecution {
                  issueId
                  jira(fields: ["key", "fixVersions"])
                  testEnvironments
                  testPlans(start: 0, limit: 10) {
										results{
											 jira(fields: ["key"])
										}
									}
              }
            }
          }
        }
  `

      return graphQLClient.request(query).then(function(data) {
            return data['getTestRuns']['results'];
      }).catch(function(error) {
        console.log('Error performing query to obtain testruns: ' + error);
      });
  }).catch( (error) => {
      console.log('Error on Authentication: ' + error);
  });
}

/**** main *****/

(async () => {

  let configFile = 'export_testruns.json'
  if (!fs.existsSync(configFile)) {
    fs.writeFileSync(configFile, "{}")
  }
  let config = JSON.parse(fs.readFileSync(configFile));
  let modifiedSince = config['modifiedSince'] || "2021-01-01T00:00:00Z"

  // obtain Test Execution issue ids
  let start = 0
  let limit = 100
  let testexecs = []
  let tes = []
  do {
    tes = await getTestExecutionIds(jql, start, limit)
    start += limit
    testexecs.push(...tes)
  } while (tes.length > 0)

  // obtain the Test Runs for the given Test Execution issue ids, modified since a given data
  let testruns = []
  start = 0
  let trs = []
  do {
    trs = await getTestRuns(testexecs, start, limit, modifiedSince)
    start += limit
    testruns.push(...trs)
  } while (trs.length > 0)

  console.log(JSON.stringify(testruns, undefined, 2))
  fs.writeFileSync('testruns.json', JSON.stringify(testruns));

  config['modifiedSince'] = new Date().toISOString().split('.')[0]+"Z"
  fs.writeFileSync(configFile, JSON.stringify(config));
})();
The previous script will generate a testruns.json file, having an array of JSON objects, each one corresponding to a test run.
Extracting test runs from Xray server/datacenter
To achieve this, once again I made some code in JavaScript that uses the Xray server/DC REST API endpoint for exporting test runs.
var axios = require('axios');
const { create } = require('domain');
const fs = require('fs');

var jira_base_url = "https://local_jiraserver.local";
//var personal_access_token = "OTE0ODc2NDE2NTgxOnrhigwOreFoyNIA9lXTZaOcgbNY";
var jira_username = 'someuser'
var jira_password = 'somepass'


async function createJiraFilter(jql) {
  var basicAuth = 'Basic ' + btoa(jira_username + ':' + jira_password);

  let url = jira_base_url + "/rest/api/2/filter"
  const filter = JSON.stringify(
      {
        "jql": jql,
        "name": "temporary filter",
        "description": "temporary filter to indirectly export test runs from",
        "favourite": false
      }
    );

  return axios.post(url, filter, {
    headers: { 'Authorization': basicAuth, 'Content-Type': 'application/json' }
    // headers: { 'Authorization': "Bearer " + personal_access_token }
  }).then(function(response) {
      console.log('success: created temporary filter ' + response.data["id"] + ' in Jira');
      return response.data;
  }).catch(function(error) {
      console.log('Error creating filter: ' + error);
  });
}

async function deleteJiraFilter(filterId) {
  var basicAuth = 'Basic ' + btoa(jira_username + ':' + jira_password);

  let url = jira_base_url + "/rest/api/2/filter/" + filterId
  return axios.delete(url, {
    headers: { 'Authorization': basicAuth }
    // headers: { 'Authorization': "Bearer " + personal_access_token }
  }).then(function(response) {
    console.log('success: created temporary filter ' + filterId + ' in Jira');
      return response.data;
  }).catch(function(error) {
      console.log('Error deleting filter: ' + error);
  });
}


async function getTestRuns(filterId, page, limit) {
  var basicAuth = 'Basic ' + btoa(jira_username + ':' + jira_password);

  var endpoint_url = jira_base_url + "/rest/raven/2.0/testruns";
  const params = new URLSearchParams({
    savedFilterId: filterId,
    includeTestFields: "issuelinks",
    page: page,
    limit: limit
  }).toString();
  const url = endpoint_url + "?" + params;

  return axios.get(url, {
      headers: { 'Authorization': basicAuth }
      // headers: { 'Authorization': "Bearer " + personal_access_token }
  }).then(function(response) {
      // console.log('success');
      // console.log(response.data);
      return response.data;
  }).catch(function(error) {
      console.log('Error exporting test runs: ' + error);
  });
}


/**** main *****/


(async () => {


  /*
    We can either use an existing Jira filter, by its id, or create a temporary one so we can define
     the JQL expression in the code.
    If we choose the latter, i.e., to create a temporary filter, then we should cleanup at the end of the process.
  */

  // Jira JQL expression to indirectly obtain the test runs from
  jql = "project = BOOK and issuetype = 'Test Execution'"

  // create a temporary filter based on a JQL expression
  let filter =  await createJiraFilter(jql);
  let filterId = filter["id"]

  // obtain the Test Runs for the given Jira filter id
  let testruns = []
  let page = 1
  let limit = 100
  let trs = []
  do {
    trs = await getTestRuns(filterId, page, limit)
    page += 1
    testruns.push(...trs)
  } while (trs.length > 0)


  // delete temporary filter, if we created it
  await deleteJiraFilter(filterId);

  console.log(JSON.stringify(testruns, undefined, 2))
  fs.writeFileSync('testruns_dc.json', JSON.stringify(testruns));

})();
This will generate a JSON file testruns_dc.json containing an array of Test Runs.
Importing test runs to InfluxDB
After we have the test runs in a local file, now we need to import it to our time series database: InfluxDB.
In InfluxDB we have a bunch of concepts; a careful reading should be done before proceeding with an actual implementation.
- bucket: All InfluxDB data is stored in a bucket. A bucket combines the concept of a database and a retention period
- measurement:A measurement acts as a container for tags, fields, and timestamps. Use a measurement name that describes your data.
- timestamp: All data stored in InfluxDB has a _time column that stores timestamps
- point: A point includes the series key, a field (key and value), and a timestamp (and optionally tags).
- series: A series key is a collection of points that share a measurement, tag set, and field key.
- field: A field includes a field key stored in the _field column and a field value stored in the _value column.
- tags: Tags include tag keys and tag values that are stored as strings and metadata; it's like an index
Therefore, we start by creating a bucket (like a database); we can do this from InfluxDB UI. I've named it "xray".
Then we need to think about naming the measurement; but what is exactly a measurement? That's an excellent question. We can think of a measurement like a big table of data. It can be used as an abstraction of a specific measurement (e.g., temperature); it's basically a name that describes our data. I used our test runs as an abstraction of the target of our measurement, and thus I named it "testrun".
Next, we need to think about how to map our test run details. We have fields and tags... so what we should them for?
The following code snippet shows the approach that I've followed, where fields are used to store dynamic information and tags are used for more static kinds of data. We have to be careful with series cardinality or else we'll hit some limits and cause performance issues; see best practices for schema design.
const point = new Point('testrun')
    .timestamp(ts)
    .tag('deployment_type', 'cloud')
    .tag('iter', iter)
    .tag('test_type', test_type)
    .tag('status', status)
    .stringField('test_key', test_key)
    .stringField('testexec_key', testexec_key)
    .stringField('testplan_key', testplan_key)
    .stringField('test_environments', test_environments)
    .stringField('version', version)
    .stringField('revision', revision)
    .stringField('testrun_id', testrun_id)
    .floatField('duration', duration)
    .intField('total_defects', total_defects)
    .intField('total_evidence', total_evidence)
I've used a tag for deployment type (e.g., "cloud" or "server"), another for an iteration identifier to ease my tests, another for the test type, and finally one for the test run status/result.
I've used one of the InfluxDB client examples and adapted it to my needs. The API is straightforward.
There's a small thing to have in mind: the previous JSON files I obtained for Xray server/DC and cloud don't follow exactly the same format. So, I'll need to normalize that whenever I upload these to InfluxDB.
#!/usr/bin/env node

import {InfluxDB, Point, HttpError} from '@influxdata/influxdb-client'
import {url, token, org, bucket} from './env.mjs'
import {hostname} from 'node:os'
import * as fs from 'fs';


function normalizeStatus(status){
  var statuses = {};
  statuses['PASSED'] = 'PASS';
  statuses['FAILED'] = 'FAIL';
  statuses['TO DO'] = 'TODO';

  if (statuses[status]) {
    return statuses[status];
  } else {
    return status;
  }
}

console.log('*** WRITE POINTS ***')
// create a write API, expecting point timestamps in nanoseconds (can be also 's', 'ms', 'us')
const writeApi = new InfluxDB({url, token}).getWriteApi(org, bucket, 'ns')
// setup default tags for all writes through this API
// writeApi.useDefaultTags({location: hostname()})

// a tag to help us diagnose the results
let iter = "i6";

// Revision custom field
let revision_cf = "customfield_10028";

// testEnvironments: dc, cloud via test execution
// fixversion: dc (no!), cloud via testexecution
// revision: dc (no!), cloud via testexecution andd custom field id (e.g., adding "customfield_xxxx" to the "jira" element)
// testplan key: dc (no!), cloud via test execution
// import Xray server/DC testruns
let testruns = JSON.parse( fs.readFileSync('./testruns_dc.json'));
for (let i = 0; i < testruns.length; i++) {
  let ts =  new Date()
  if ((testruns[i]["start"] !== undefined) && (testruns[i]["finish"] !== null)) {
    ts = new Date(testruns[i]["start"])
  }

  let duration = -1
  if ((testruns[i]["finish"] !== undefined) && (testruns[i]["finish"] !== null)) {
    duration = (Date.parse(testruns[i]["finish"]) - ts) / 1000.0;
  }

  let testrun_id = testruns[i]["id"];
  let test_key = testruns[i]["testKey"];
  let testexec_key = testruns[i]["testExecKey"];
  let test_type = testruns[i]["type"];
  let status = normalizeStatus(testruns[i]["status"]);
  let total_defects = testruns[i]["defects"].length;
  let total_evidence = testruns[i]["evidences"].length;

  const point = new Point('testrun')
    .timestamp(ts)
    .tag('deployment_type', 'server')
    .tag('iter', iter)
    .stringField('test_key', test_key)
    .stringField('testexec_key', testexec_key)
    .tag('test_type', test_type)
    .tag('status', status)
    .stringField('testrun_id', testrun_id)
    .floatField('duration', duration)
    .intField('total_defects', total_defects)
    .intField('total_evidence', total_evidence)

  writeApi.writePoint(point)
  console.log(` ${point.toLineProtocol(writeApi)}`)
}


// import Xray cloud testruns
testruns = JSON.parse( fs.readFileSync('./testruns.json'));
for (let i = 0; i < testruns.length; i++) {
  let ts =  new Date()
  if ((testruns[i]["startedOn"] !== undefined) && (testruns[i]["startedOn"] !== null)) {
    ts = new Date(testruns[i]["startedOn"])
  }

  let duration = -1
  if ((testruns[i]["finishedOn"] !== undefined) && (testruns[i]["finishedOn"] !== null)) {
    duration = (Date.parse(testruns[i]["finishedOn"]) - ts) / 1000.0;
  }

  let testrun_id = testruns[i]["id"];
  let test_key = testruns[i]["test"]["jira"]["key"];
  let testexec_key = testruns[i]["testExecution"]["jira"]["key"];
  let testplan_key = testruns[i]["testExecution"]["testPlans"]["results"].map( function(tp) {
    return tp["jira"]["key"];
  }).join(',');
  let test_environments = testruns[i]["testExecution"]["testEnvironments"].join(',');
  let version = testruns[i]["testExecution"]["jira"]["fixVersions"].map( function(version) {
    return version["name"];
  }).join(',');
  let revision = testruns[i]["testExecution"]["jira"][revision_cf];

  let test_type = testruns[i]["testType"]["name"];
  let status = normalizeStatus(testruns[i]["status"]["name"]);
  let total_defects = testruns[i]["defects"].length;
  let total_evidence = testruns[i]["evidence"].length;

  const point = new Point('testrun')
    .timestamp(ts)
    .tag('deployment_type', 'cloud')
    .tag('iter', iter)
    .stringField('test_key', test_key)
    .stringField('testexec_key', testexec_key)
    .stringField('testplan_key', testplan_key)
    .stringField('test_environments', test_environments)
    .stringField('version', version)
    .stringField('revision', revision)
    .tag('test_type', test_type)
    .tag('status', status)
    .stringField('testrun_id', testrun_id)
    .floatField('duration', duration)
    .intField('total_defects', total_defects)
    .intField('total_evidence', total_evidence)
  writeApi.writePoint(point)
  console.log(` ${point.toLineProtocol(writeApi)}`)
}


// WriteApi always buffer data into batches to optimize data transfer to InfluxDB server.
// writeApi.flush() can be called to flush the buffered data. The data is always written
// asynchronously, Moreover, a failed write (caused by a temporary networking or server failure)
// is retried automatically. Read `writeAdvanced.js` for better explanation and details.
//
// close() flushes the remaining buffered data and then cancels pending retries.
try {
  await writeApi.close()
  console.log('FINISHED!')
} catch (e) {
  console.error(e)
  if (e instanceof HttpError && e.statusCode === 401) {
    console.log('Try to setup a new InfluxDB database.')
  }
  console.log('\nFinished with ERROR')
}
After uploading the data, we can query it using Flux.
A Flux script/query starts by defining the source bucket using from(bucket: "somebucket"), then an absolute/relative time range using range(), followed by one or more filters using filter(fn: (r) => ... ).
After data is retrieved it can be transformed (e.g., grouped, manipulated). I would recommend having a look at Time to Awesome online book.
A simple Flux query example follows.
from(bucket: "somebucket")
|> range(start: -5d, stop: -1d)
|> filter(fn: (r) => r._field == "field1")
|> group(columns: ["tag1", "tag2"])
We'll see ahead some concrete Flux examples.
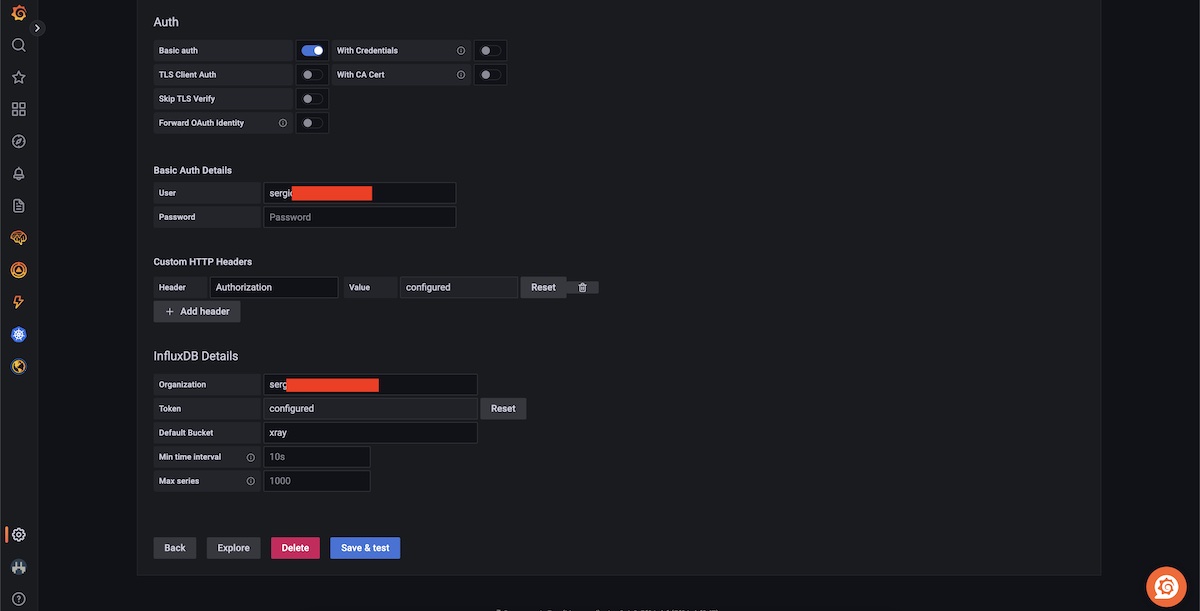
Configuring and using Grafana to analyze and visualize the test runs
In Grafana, we need to configure a data source.
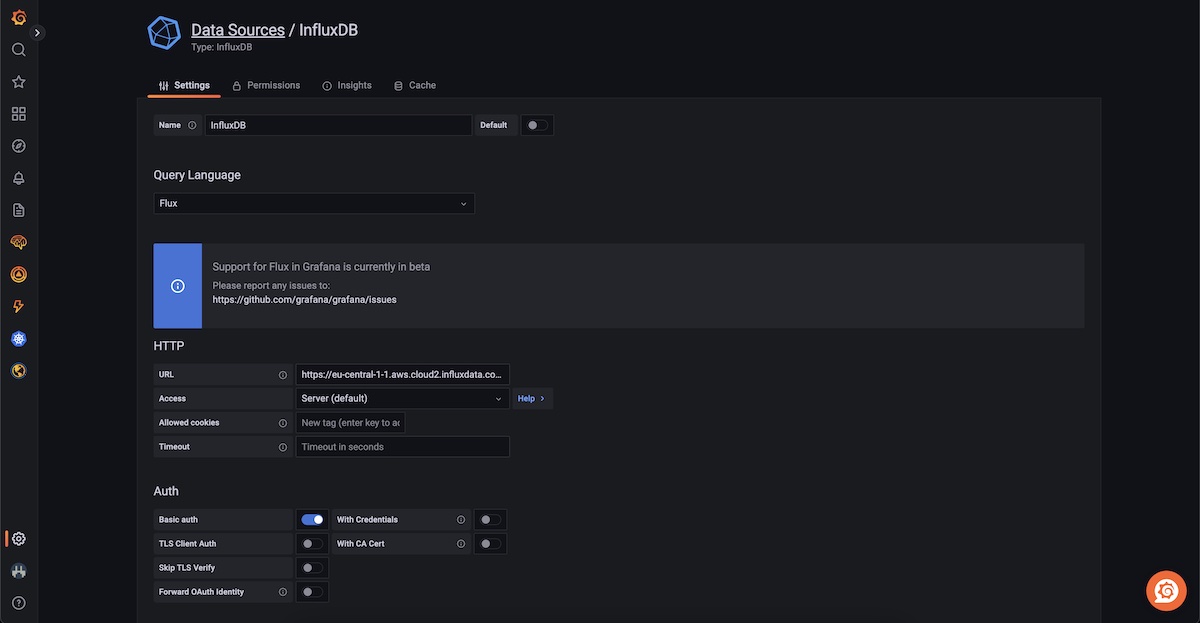
Then we can create a dashboard and add multiple panels to visualize the information we need.
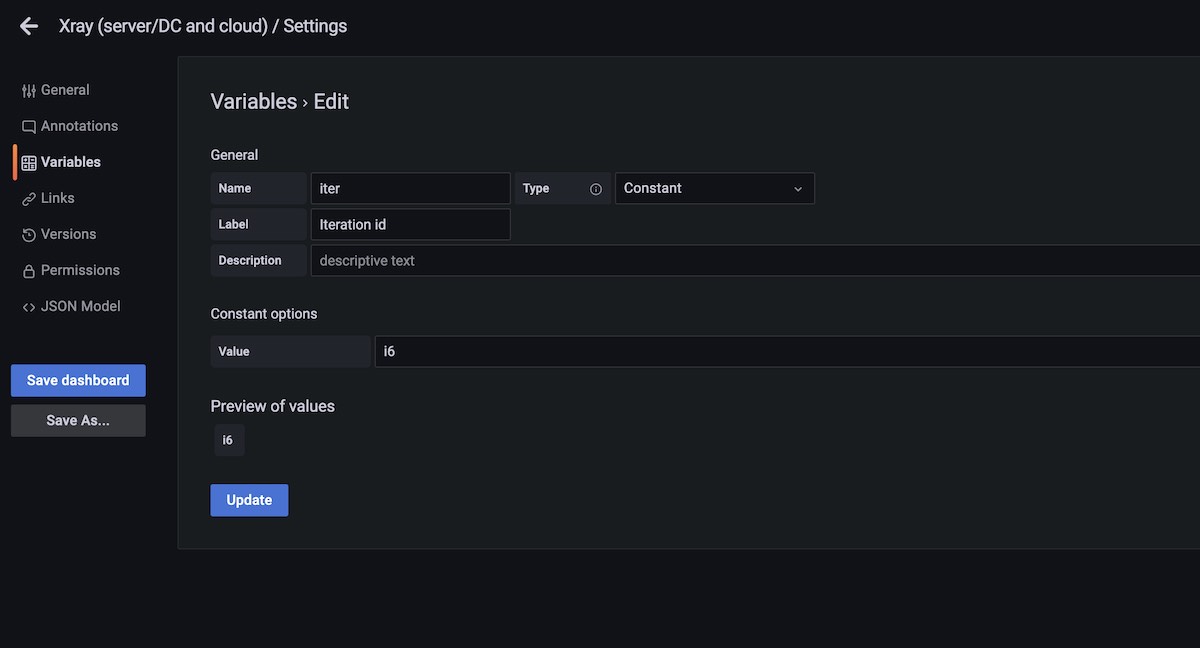
We may find it useful to define some variables that apply across all panels and related queries that we'll use on our dashboard. These can be used later on using the ${variable_name} syntax.
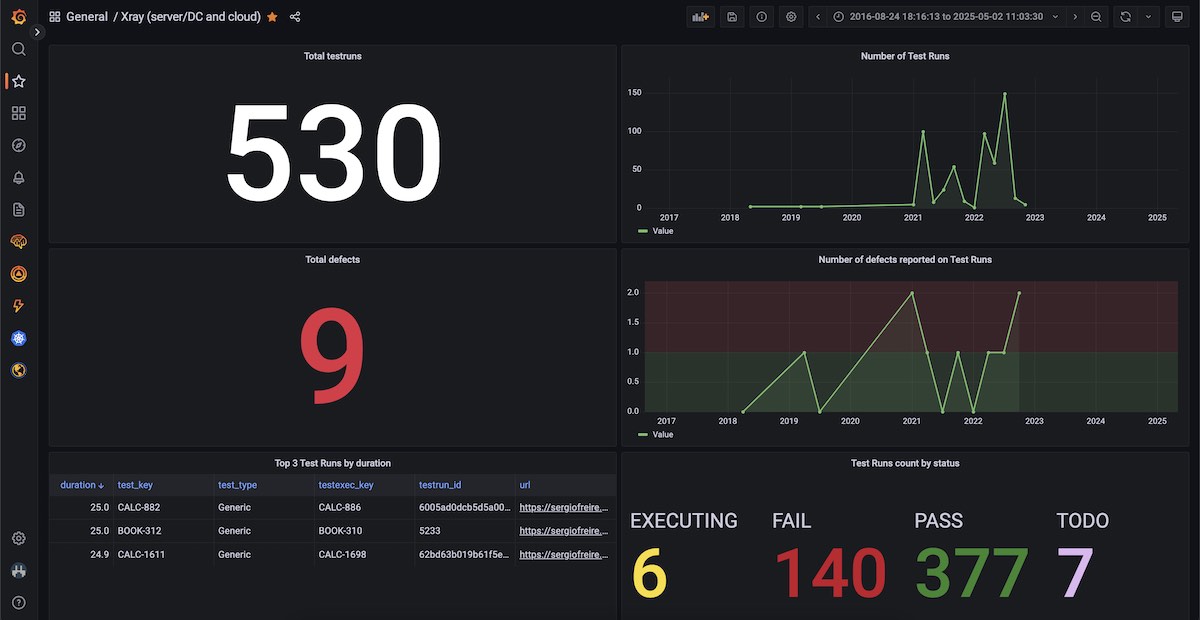
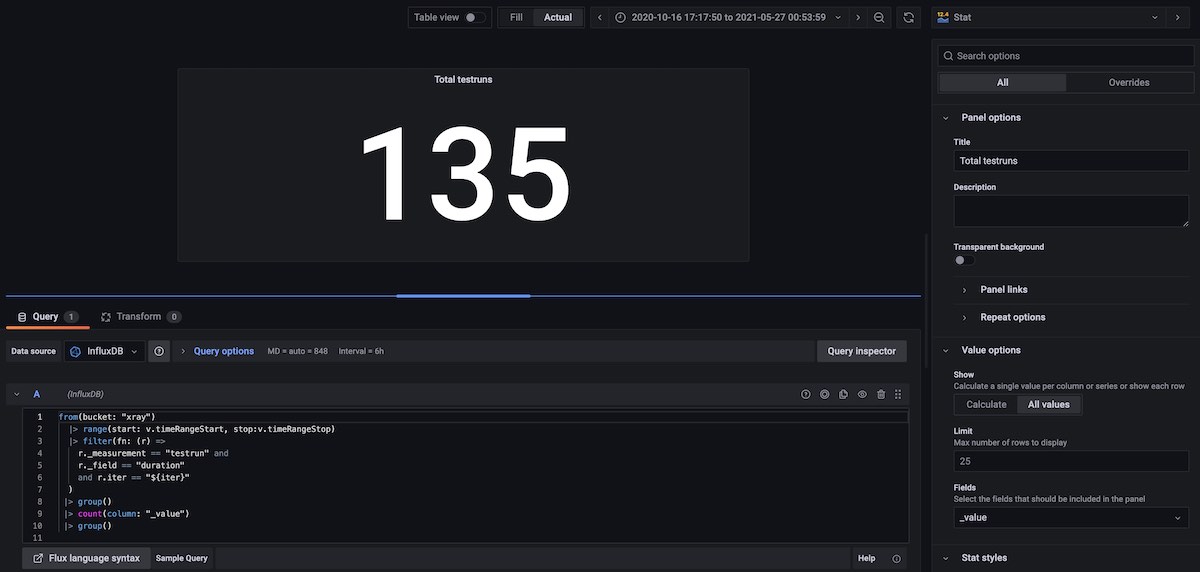
Total Test Runs, for the selected timeframe
In this example, we need to start by joining the multiple tables from the input stream. For that we use the group() statement; we may specify the column it will use, which by default will be the _value column. We can then use the count() function.
from(bucket: "xray")
  |> range(start: v.timeRangeStart, stop:v.timeRangeStop)
  |> filter(fn: (r) =>
    r._measurement == "testrun" and
    r._field == "duration"
    and r.iter == "${iter}"
  )
 |> group()
 |> count(column: "_value")
 |> group()
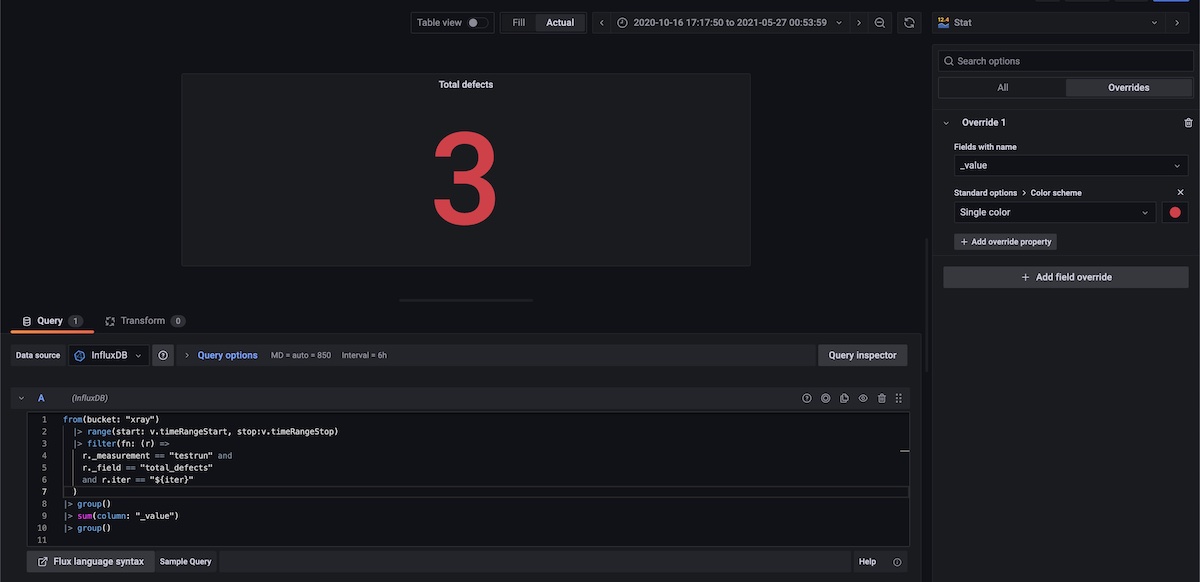
Total Defects, for the selected timeframe
Here we use the sum() aggregation function.
from(bucket: "xray")
  |> range(start: v.timeRangeStart, stop:v.timeRangeStop)
  |> filter(fn: (r) =>
    r._measurement == "testrun" and
    r._field == "total_defects"
    and r.iter == "${iter}"
  )
|> group()
|> sum(column: "_value")
|> group()
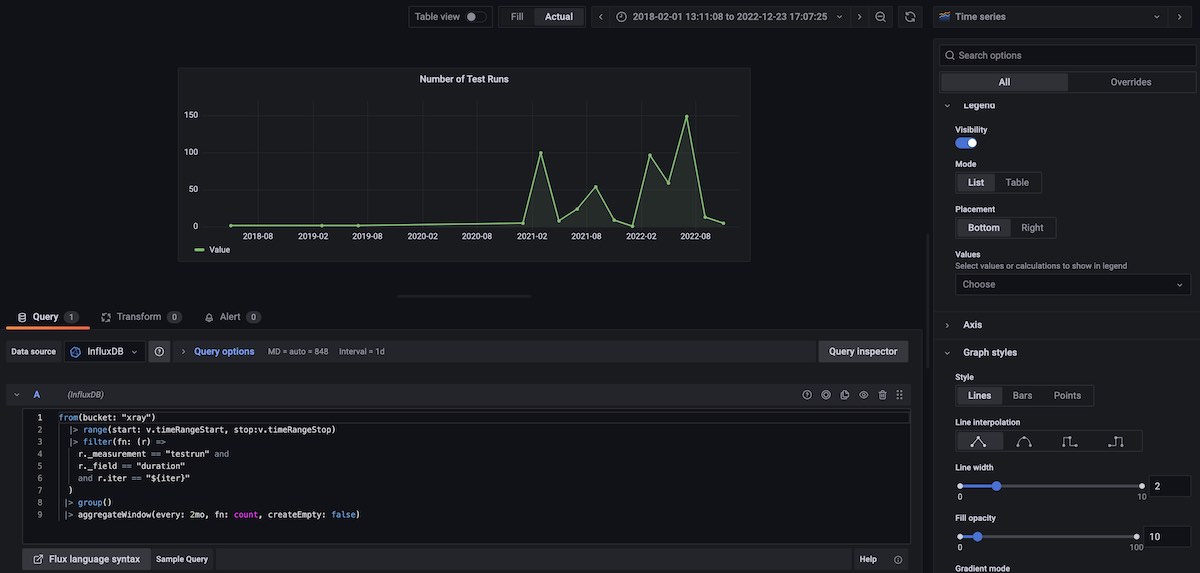
Number of Test Runs, grouped in 2 months blocks, for the selected timeframe
In this example, we use the aggregateWindow() function which is a nice way to perform a calculus for a certain time window. The following snippet shows doing a count for every 2 months window. Note that we have to do a group() before to join the multiple input data tables.
from(bucket: "xray")
  |> range(start: v.timeRangeStart, stop:v.timeRangeStop)
  |> filter(fn: (r) =>
    r._measurement == "testrun" and
    r._field == "duration"
    and r.iter == "${iter}"
  )
 |> group()
 |> aggregateWindow(every: 2mo, fn: count, createEmpty: false)
Number of defects reported on Test Runs, grouped in 3 months blocks, for the selected timeframe
In this case, we use the aggregateWindow() together with the sum aggregation function.
from(bucket: "xray")
  |> range(start: v.timeRangeStart, stop:v.timeRangeStop)
  |> filter(fn: (r) =>
    r._measurement == "testrun" and
    r._field == "total_defects"
    and r.iter == "${iter}"
  )
|> group()
|> aggregateWindow(every: 3mo, fn: sum, createEmpty: false)
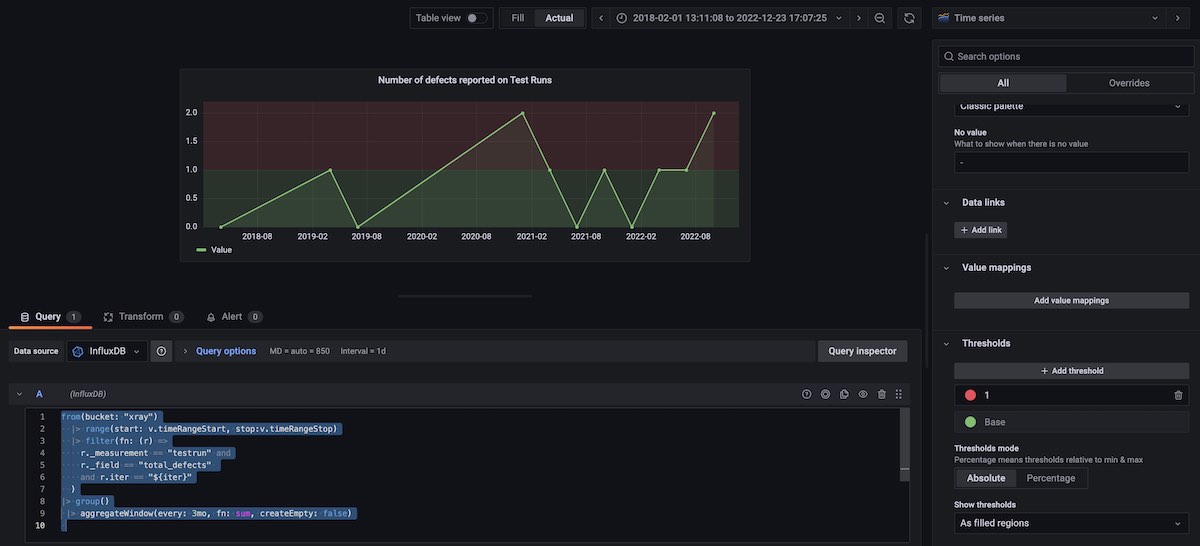
Table with top 3 Test Runs by duration, for the selected timeframe
Here I use the top() function to obtain 3 rows of data (i.e., 3 test runs) based on the duration field. There's a nice trick here: the schema.fieldsAsCols() function will map all the fields to columns, named by the respective field key.
I also have created a new column "url", using the Flux map() function, that creates the URL based on two other columns that contain the Test and the Test Execution issue keys. I've considered a typical Xray cloud link for seeing the test run details.
Then I added an override to format the "url" field as a link, using a "data link" with the value ${__value.text}.
import "influxdata/influxdb/schema"

from(bucket: "xray")
  |> range(start: v.timeRangeStart, stop:v.timeRangeStop)
  |> filter(fn: (r) =>
    r._measurement == "testrun" and
    (r._field == "duration"  or r._field == "testrun_id" or r._field == "test_key" or r._field == "testexec_key")
    and r.iter == "$iter"
  )
|> schema.fieldsAsCols()
|> group()
|> keep(columns: ["_time", "testrun_id", "test_key", "testexec_key", "test_type", "duration"])
|> top(n: 3, columns: ["duration"])
|> map(fn: (r) => ({r with url:  "https://sergiofreire.atlassian.net/plugins/servlet/ac/com.xpandit.plugins.xray/execution-page?ac.testExecIssueKey=${r.testexec_key}&ac.testIssueKey=${r.test_key}"
}))
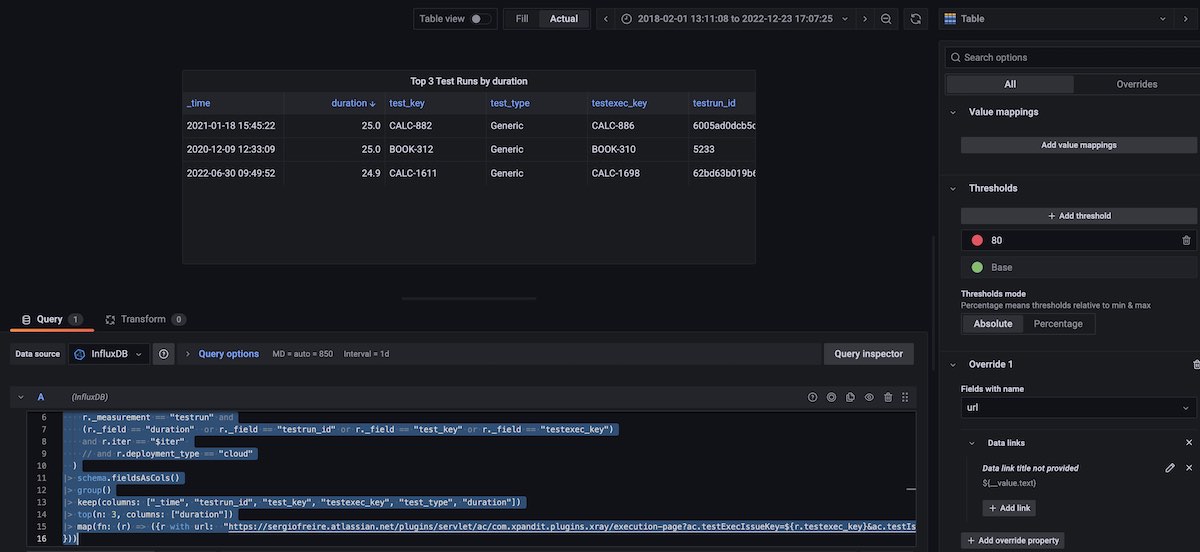
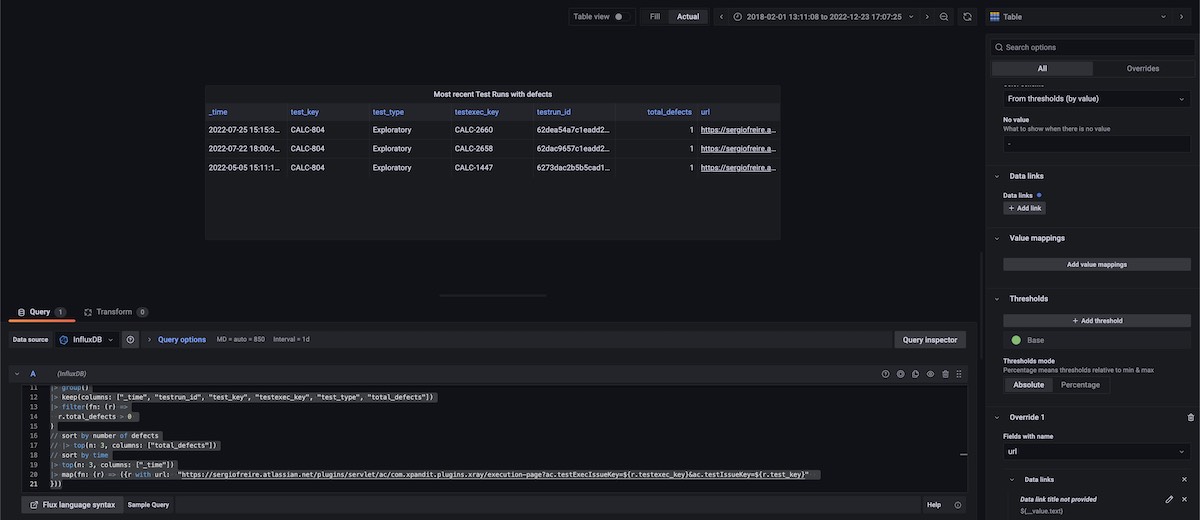
Table with the 3 most recent Test Runs having defects, for the selected timeframe
In this case, mostly similar to the previous one, I've used two filter() statements, where the last one filters test runs that just have reported defects.
import "influxdata/influxdb/schema"

from(bucket: "xray")
  |> range(start: v.timeRangeStart, stop:v.timeRangeStop)
  |> filter(fn: (r) =>
    r._measurement == "testrun" and
    (r._field == "duration"  or r._field == "testrun_id" or r._field == "test_key" or r._field == "testexec_key" or r._field == "total_defects")
    and r.iter == "$iter"
  )
|> schema.fieldsAsCols()
|> group()
|> keep(columns: ["_time", "testrun_id", "test_key", "testexec_key", "test_type", "total_defects"])
|> filter(fn: (r) =>
  r.total_defects > 0
)
|> top(n: 3, columns: ["_time"])
|> map(fn: (r) => ({r with url:  "https://sergiofreire.atlassian.net/plugins/servlet/ac/com.xpandit.plugins.xray/execution-page?ac.testExecIssueKey=${r.testexec_key}&ac.testIssueKey=${r.test_key}"
}))
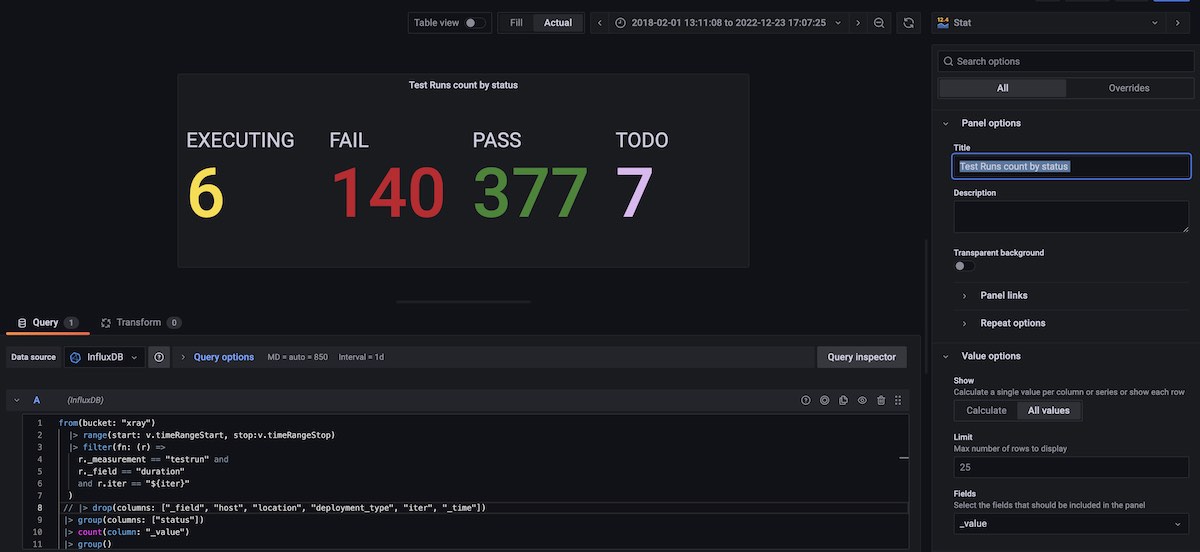
Test Runs counters by status
from(bucket: "xray")
  |> range(start: v.timeRangeStart, stop:v.timeRangeStop)
  |> filter(fn: (r) =>
    r._measurement == "testrun" and
    r._field == "duration"
    and r.iter == "${iter}"
  )
 |> group(columns: ["status"])
 |> count(column: "_value")
 |> group()
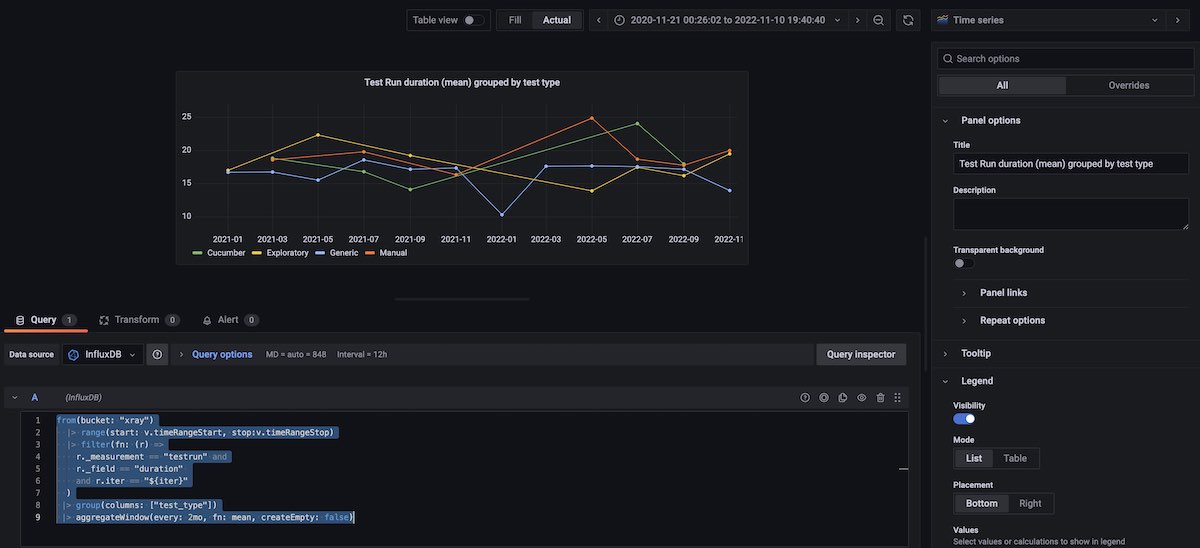
Test Run duration (mean) grouped by test type
from(bucket: "xray")
  |> range(start: v.timeRangeStart, stop:v.timeRangeStop)
  |> filter(fn: (r) =>
    r._measurement == "testrun" and
    r._field == "duration"
    and r.iter == "${iter}"
  )
 |> group(columns: ["test_type"])
 |> aggregateWindow(every: 2mo, fn: mean, createEmpty: false)
Final considerations
Overall, this was a very interesting exercise.
Extracting data from my source tool (i.e. Xray) was the easiest part, honestly.
I struggled more with InfluxDB kind of concepts; I'm glad I had a call with their team, which proactively reached out and helped clarify some basics. The biggest challenge for me was moving from a SQL mindset to a time series database, where data is returned as a stream of tables, for example.
Grafana is a very powerful tool, and its integration with InfluxDB seems a good fit. Sometimes I had some doubts with renaming columns or grouping data, if I should do it directly at the InfluxDB level (i.e., on the query), or by using the transformations that Grafana provides.
In the end I was able to implement a bunch of charts and listings with information that could be useful from a testing perspective.
I really think that these are powerful tools that can probably address many reporting kinds of needs teams may have. Some of the team I worked with, used Grafana for different purposes (e.g., testing, infrastructure/monitoring metrics).
Maybe these can also be useful to you, who knows?
Useful references
Thanks for reading this article; as always, this represents one point in time of my evolving view :) Feedback is always welcome. Feel free to leave comments, share, retweet or contact me. If you can and wish to support this and additional contents, you may buy me a coffee ☕